The Order Management Reports system generates reports in the form of several different graphs.
These reports allow the client to quickly and efficiently see trends in their business. The system also gives clients the option to see a printable version of the report for fast and easy printing.
Included below is a quick summary of each report and a screenshot that gives a preview of each report.
Total Sales by Top 15 States
Graphs the total amount of sales per state for the top 15 states. Each line on the graph represents a single states sales amount vs date.
Total Sales Amount
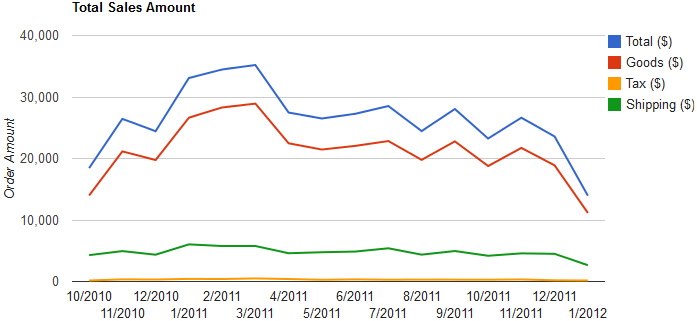
Graphs the total amount of sales made by the client. The report graph has a seperate lines for total amount, amount in goods sold, amount in taxes, and amount in shipping.
Average Order Amount
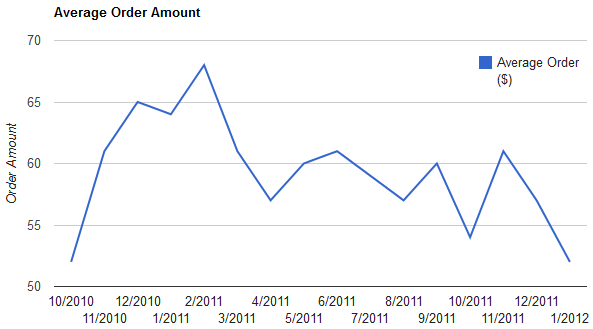
Graphs the average amount per order made. Lets the client see the order volume per date data.
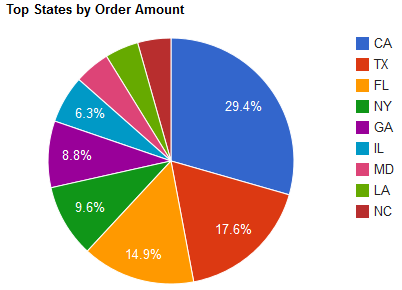
Top States by Order Amount
Graphs the top states and their total order amounts in a pie chart. Allows the client to quickly see which states their company performs best in.
Top Payment Types Used by Amount
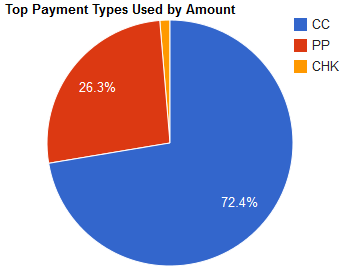
Graphs the top payment types based on amounts processed and their percentages in a pie chart. Allows the clients to see which payment type is most popular.
Top Shipping Carriers Used by Amount
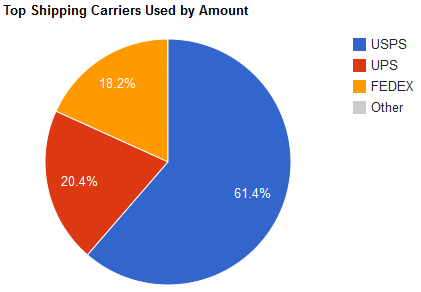
Graphs the top shipping carriers by amount of goods shipped and their percentages in a pie chart. Allows the client to see which shipping carrier their customers prefer most.
Top 75 Users by Order Amount
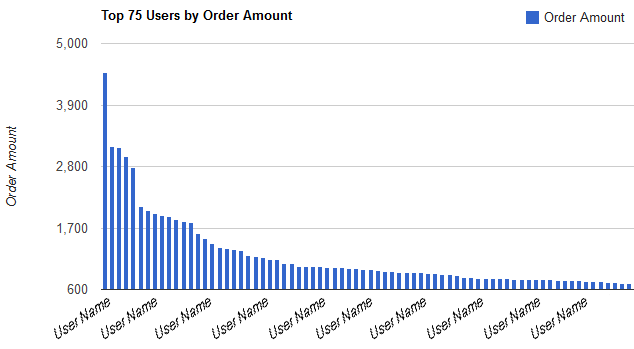
Graphs the top 75 users by the amount of their order. Quickly allows the client to see how much their top customers are spending on their products.
Total Number of Orders
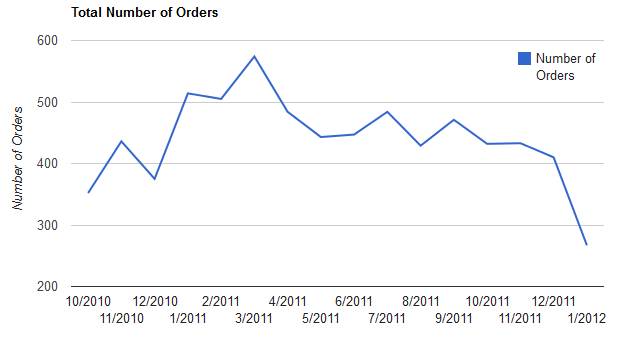
Graphs the total amount of orders in a line chart. Lets the client see the order volume on a time basis.
Total Orders by Top 15 States
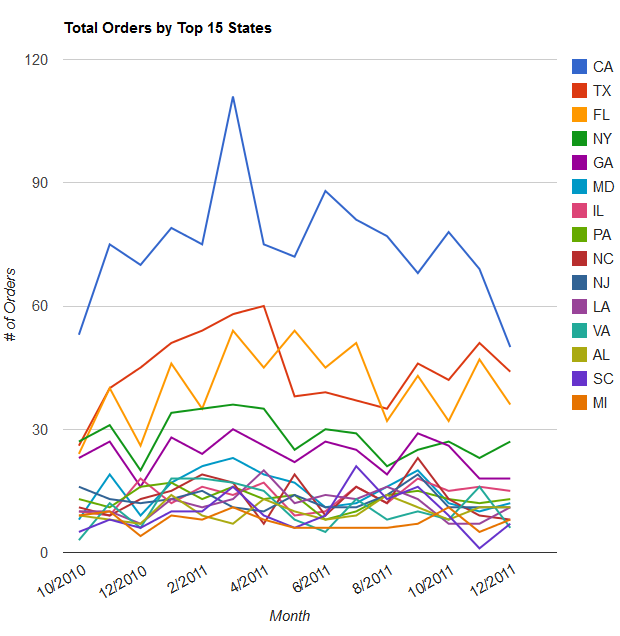
Graphs the total amount of orders made per state for the top 15 states. Each line on the graph represents a single states order amount vs date. Lets the client see which state is generating the most revenue.
Popular Products
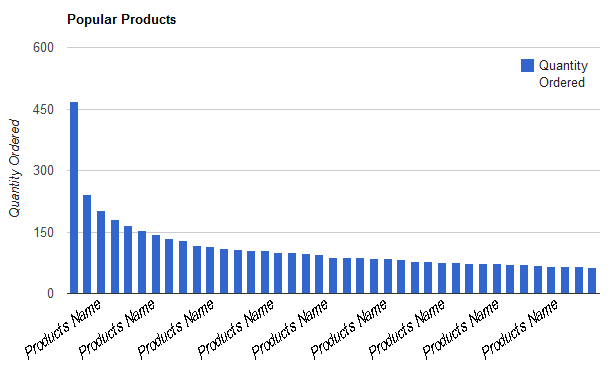
Graphs the most popular products sold in a bar graph. Allows the client to quickly see which products are selling the most.
Popular Categories
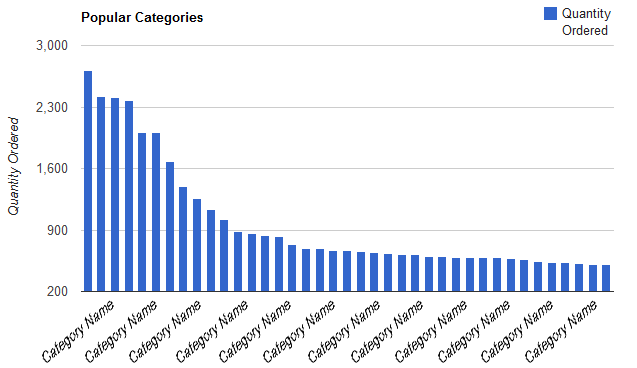
Graphs the most popular categories sold in a bar graph. Allows the client to quickly see which categories are performing the best.
Least Popular Products
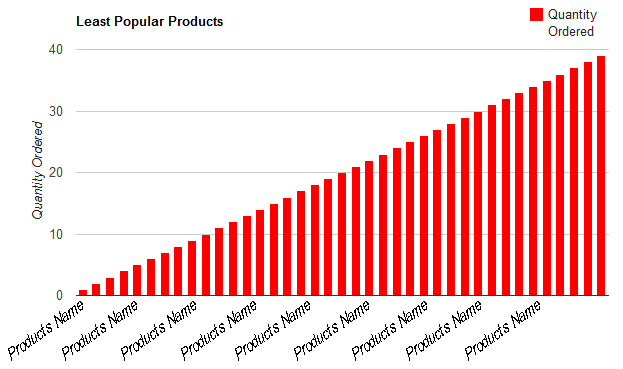
Graphs the least popular products sold in a bar graph. Allows the client to quickly see which products are not performing well.
Least Popular Categories
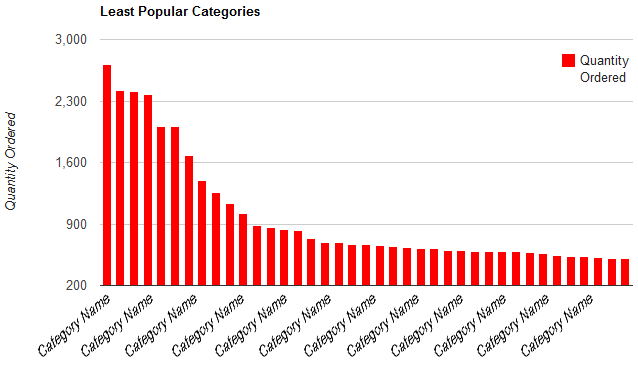
Graphs the least popular categories sold in a bar graph. Allows the client to quickly see which categories are not performing well.
Top States by Number of Orders
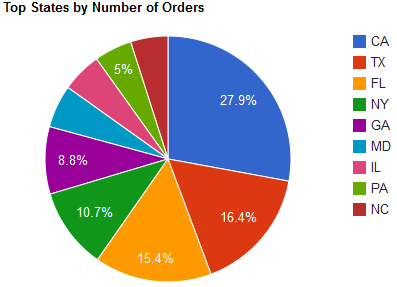
Graphs the top states in order volume in a pie chart. Allows the client to see which states are generating the most orders.
Top Countries by Number of Orders
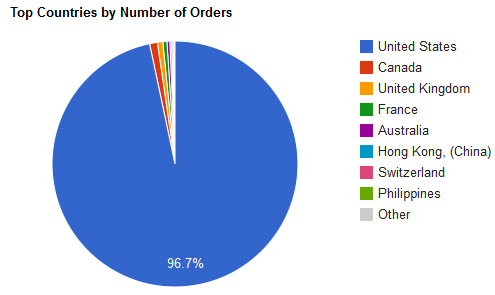
Graphs the top countries in order volume in a pie chart. Allows the client to see which countries are generating the most orders.
Top Payment Types Used by Number of Orders
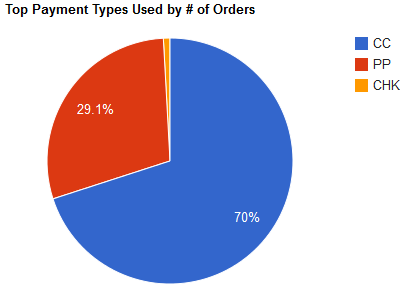
Graphs the top payment types based on order volume in a pie chart. Allows the client to see which payment type is more popular when based on order volume.
Top Shipping Carriers Used by Number of Orders
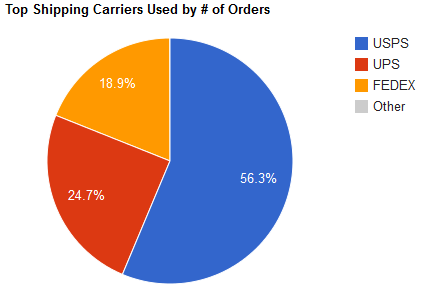
Graphs the top shipping carriers used by order volume in a pie chart. Allows the client to see which shipping carrier is more popular when based on order volume.
Top 75 Users by Number of Orders
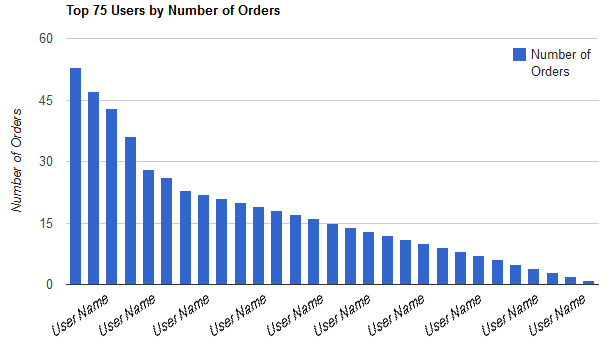
Graphs the top 75 users by order volume. Quickly allows the client to see how many orders their top users are making.